
Let’s be honest: Marketing performance tracking is just the simple way of saying "measuring what happens after you launch a campaign." It’s how you figure out what’s actually working and what’s just burning through your budget. This process turns marketing from a guessing game into a reliable engine for business growth.
Why Marketing Performance Tracking Matters
Ever tried to build furniture without the instructions? You might end up with something that looks like a chair, but it's probably wobbly. Running marketing campaigns without tracking is pretty much the same. You're spending time and money, but you have no clue if you're building something that works or just heading for a fall.
Think of tracking as the navigation system for your marketing. It’s what turns your campaigns from an expense into a strategic, measurable investment. When you systematically measure your efforts, you can show everyone exactly what value your team brings to the business.
Justify Budgets and Prove Your Worth
When it's time to ask for a bigger budget, data is your best friend. It’s the difference between saying, "I think this new campaign will work," and stating, "Our last campaign delivered a 300% return on ad spend and brought in 500 new qualified leads." That kind of data-backed argument is what gets budgets approved.
Marketing performance tracking gives you the hard evidence you need to connect your team's activities directly to revenue. It makes it much easier to secure investment and prove your team's value.
To get a handle on your impact, knowing how to measure marketing effectiveness is the foundation for getting better over time. This knowledge shifts the conversation from "How much did you spend?" to "What results did you drive?"
Make Smarter Strategic Decisions
Gut feelings are great, but they shouldn't be your entire marketing strategy. Performance tracking gives you the objective data you need to make informed decisions. When you look at the numbers, you can answer the critical questions that will shape your next move.
For instance, you might find out that:
- Email marketing brings in more high-value customers than your social media ads.
- Your blog posts about a specific topic have a high conversion rate.
- One of your main ad creatives is underperforming on every channel.
Armed with insights like these, you can double down on what’s working, fix what’s broken, and—most importantly—stop wasting money on things that don’t deliver. This creates a feedback loop that powers sustainable growth, ensuring every decision you make is smarter than the last. It’s not just about looking back; it’s about creating a clear roadmap for future wins.
The Essential Metrics You Need to Track

Jumping into marketing data can feel overwhelming. With countless metrics on your dashboard, it's easy to get lost in numbers that don't tell you what's working.
Here’s the secret: effective marketing performance tracking isn't about measuring everything. It's about measuring the right things.
To make sense of it all, it helps to group metrics by the story they tell about your customer's journey. Let’s break them down into Audience Growth, Engagement, and Business Impact. This approach connects your daily work to the bottom-line results that matter.
Audience Growth Metrics
Before you can convert anyone, you have to get their attention. Audience growth metrics show how well you're expanding your reach and pulling new people into your brand's world. Think of these as your top-of-funnel indicators—the first signs that your brand awareness efforts are paying off.
A fundamental metric here is website traffic. You need to know not just how many people visit, but where they're coming from. Are they finding you through organic search, paid ads, or social media? Answering that helps you focus on the channels that deliver the most promising leads.
Key metrics for audience growth include:
- Website Traffic: The total number of people visiting your site.
- Traffic by Source/Channel: Where your visitors come from (e.g., Organic, Social, Paid, Direct). This shows you which channels work best.
- New vs. Returning Visitors: Are you attracting new people or building a loyal base? A healthy mix is the goal.
- Follower Growth: On social media, a steady climb in followers signals that your content is resonating.
Engagement Metrics
Once you've grabbed someone's attention, the next question is: do they care? Engagement metrics measure how people interact with your content. High engagement is a great sign that your message is connecting and building a relationship.
On the other hand, low engagement is a red flag. It could mean your content isn't relevant or you're talking to the wrong people. Tracking these numbers helps you fine-tune your messaging.
Engagement is the bridge between awareness and conversion. It shows that your audience isn't just seeing your content—they're actively participating with it. This is a critical step in building trust.
Common engagement metrics to watch are:
- Average Time on Page: How long do people stick around on a page? A longer duration usually means your content is valuable.
- Bounce Rate: The percentage of visitors who land on a page and leave without clicking anywhere else.
- Click-Through Rate (CTR): What percentage of people who see your ad or link actually click on it? This is a key metric for judging ad performance.
- Likes, Comments, and Shares: Direct feedback on how much your social media content connects with your followers.
Conversion and Business Impact Metrics
This is where your marketing activities translate into business results. These numbers prove your marketing ROI and tell you how effectively you're turning prospects into paying customers.
These are the KPIs your executives want to see. If you need to justify your budget, these are the metrics you need to master. They connect the dots between clicks, leads, and revenue.
If you want a comprehensive dashboard, check out this list of important marketing KPIs you should be tracking.
Critical business impact metrics include:
- Conversion Rate: The percentage of visitors who complete a goal, like filling out a form or making a purchase.
- Customer Acquisition Cost (CAC): The total cost to get a new customer. The math is simple: Total Marketing Spend / Number of New Customers. Your goal is to keep this low.
- Customer Lifetime Value (LTV): The total revenue you can expect from a single customer over your entire relationship with them.
- Return on Ad Spend (ROAS): This measures the revenue you generate for every dollar spent on advertising. It's a direct gauge of how profitable your ad campaigns are.
Key Marketing Metrics by Funnel Stage
Tracking metrics at each stage of the funnel gives you a complete picture of your marketing and helps you guide customers all the way to a sale.
Tackling the Tough Questions: Data Collection and Attribution
Not long ago, tracking marketing performance was more straightforward. But things have changed, making data collection and attribution two of the biggest puzzles for marketers today.
The simple days of tracking every move with third-party cookies are gone. Growing privacy concerns have brought new rules and technologies that change how we gather data. This isn’t a small adjustment; it’s a rewrite of the old marketing playbook.
Now, marketers have to navigate privacy laws and browser restrictions. The challenge is getting the data you need to make smart decisions without alienating the customers you're trying to connect with. It’s all about being more thoughtful and transparent.
The Big Shift to First-Party Data
With third-party cookies disappearing, first-party data is the new gold standard. This is the information you collect directly from your audience with their permission. Think of it as building a real relationship based on trust.
You get first-party data from direct interactions, like:
- Email newsletter sign-ups
- Website form submissions
- A customer's purchase history
- Surveys and direct feedback
This data isn't just more reliable; it's more powerful. It gives you a direct line to your customers, letting you understand what they actually want.
This move toward first-party data is a win-win. Customers gain more control over their information, and businesses get higher-quality insights straight from the source. It’s the foundation of a modern marketing strategy.
Making Sense of Marketing Attribution
Once you have your data, the next big hurdle is attribution. This is just a fancy way of asking: "Which marketing effort gets the credit for a sale?"
Imagine a customer sees a Facebook ad, reads your blog, and then clicks an email link before buying something. Which channel gets the credit? The answer depends on the attribution model you use.
Data-driven marketing has become essential, especially as privacy laws limit old tracking methods. With major browsers blocking third-party trackers, connecting the dots is harder than ever. A customer's journey can involve anywhere from 20 to 500 touchpoints before a purchase. That's why attribution is so critical—it helps you figure out which campaigns are actually driving results.
Common Attribution Models, Explained
Different models assign credit in different ways, and each has its place. Understanding the basics is the first step to picking the right one.
- First-Touch Attribution: This model gives 100% of the credit to the very first interaction a customer had with your brand. It’s perfect for figuring out which channels bring new people in.
- Last-Touch Attribution: The opposite of first-touch, this one gives all the credit to the final click before a conversion. It’s simple, but it ignores the work your other channels did. Learn more in our deep dive on last-touch attribution.
- Multi-Touch Attribution: This is more sophisticated. Multi-touch models spread credit across several touchpoints. A few popular types include:
- Linear: Splits credit equally among every touchpoint.
- Time-Decay: Gives more credit to interactions that happened closer to the sale.
- U-Shaped: Gives the most credit to the first and last touches, splitting the rest among the middle interactions.
Picking the right model depends on your sales cycle and business goals. One of the trickiest parts of data collection is tracking phone calls, but it's easier than ever to implement robust call tracking for your campaigns.
By solving these challenges, you can finally connect the dots and prove the real value of your marketing.
Choosing Your Marketing Tracking Tools
Having the right tools for marketing performance tracking is the difference between clarity and chaos. Think of it like a workshop. A carpenter and a mechanic both need tools, but not the same ones. Your marketing tech stack should be built for your specific job.
It's helpful to think in categories. Most marketing stacks are built on three pillars: analytics platforms, CRM systems, and visualization dashboards. These tools work together to gather, organize, and make sense of your data.
Analytics Platforms: The Foundation
Analytics platforms are your starting point. They collect raw data about how people interact with your website or app. They answer the basic "what happened?" questions.
The most well-known platform is Google Analytics 4 (GA4). It tells you how many people visited your site, which pages they looked at, and where they came from. It's the essential first step to understanding user behavior.
CRM Systems: The Customer Hub
While analytics platforms track anonymous behavior, Customer Relationship Management (CRM) systems are about people. A CRM, like HubSpot or Salesforce, is your central database for every lead and customer.
It stores contact info, interaction history, and purchase data. By connecting your marketing to your CRM, you can see which campaigns generate real leads that your sales team can close.
Your CRM is the bridge connecting marketing efforts to sales outcomes. It turns anonymous data points into named individuals, letting you track the entire customer journey from first click to final purchase.
Visualization Dashboards: The Storyteller
Data is only useful if you can understand it at a glance. Visualization dashboards, like Looker Studio or Tableau, tell the story of your data. They pull information from your analytics platforms, CRM, and other sources into one clean dashboard.
Instead of digging through spreadsheets, you get a single view of your marketing performance. This makes it simple to spot trends and present your findings. For a deeper look, a business intelligence software comparison can help you find the perfect fit.
How to Choose the Right Tools
Building your stack doesn't have to be complicated. The key is to pick tools that fit what you need now, but also have room to grow.
Here’s a simple framework to guide your decision:
- Assess Your Goals: Are you focused on leads, e-commerce sales, or brand awareness? Your goal will determine which tools matter most.
- Consider Your Budget: Powerful tools exist at every price point. Start with free options like Google Analytics and Looker Studio, then upgrade as your business grows.
- Prioritize Integration: This is critical. Your tools must be able to talk to each other. An analytics platform that doesn’t sync with your CRM creates data silos, which is the problem you’re trying to solve.
Picking the right tools is a strategic move. Start with a solid foundation, make sure your systems are connected, and build a stack that delivers clear, actionable insights.
Advanced Strategies for Proving Marketing ROI
When you need to prove your marketing's impact on the bottom line, standard reports aren't enough. Clicks and traffic are fine, but they don’t answer leadership's tough questions about return on investment.
This is about moving from correlation to causation. It’s not enough to show that sales went up when a campaign was running; you need to prove your campaign caused the increase. This requires a more scientific approach to marketing performance tracking.
The Comeback of Marketing Mix Modeling
One powerful technique is Marketing Mix Modeling (MMM). Think of it as a high-level statistical analysis that looks at the big picture. It examines all your marketing inputs—like ad spend across different channels—and connects them to sales outcomes over time.
MMM helps answer questions like, "For every dollar we spend on TV ads, how much revenue do we generate?" It's popular again because it doesn't need individual user tracking or cookies, making it a privacy-friendly way to measure performance.
The reality is that most marketers are still struggling. A 2025 Supermetrics report found that 41% of marketers can't properly measure their cross-channel impact. To fix this, nearly half (49%) are turning to MMM. Just know that effective MMM often requires serious ad spends—around $2 million annually—making it a better fit for larger companies.
Isolating Your Impact with Controlled Experiments
While MMM gives you the top-down view, controlled experiments are about granular analysis. These methods let you test specific variables to see exactly what’s moving the needle.
You’re probably familiar with the two most common types:
- A/B Testing (or Split Testing): This is a classic experiment. You compare two versions of one thing—an email subject line, a landing page headline, an ad creative—to see which performs better.
- Lift Studies: These are more involved but powerful for measuring the true impact of an ad campaign. You split your audience into two groups: a test group that sees your ads and a control group that doesn't. By comparing the conversion rates between the two, you can measure the "lift" your ads generated.
Proving ROI isn't about finding one magic number. It's about using a combination of advanced models and continuous testing to build a complete picture of your marketing performance.
Each channel performs differently, and tracking them separately is crucial. This image compares two common channels, showing how different tactics produce different results.
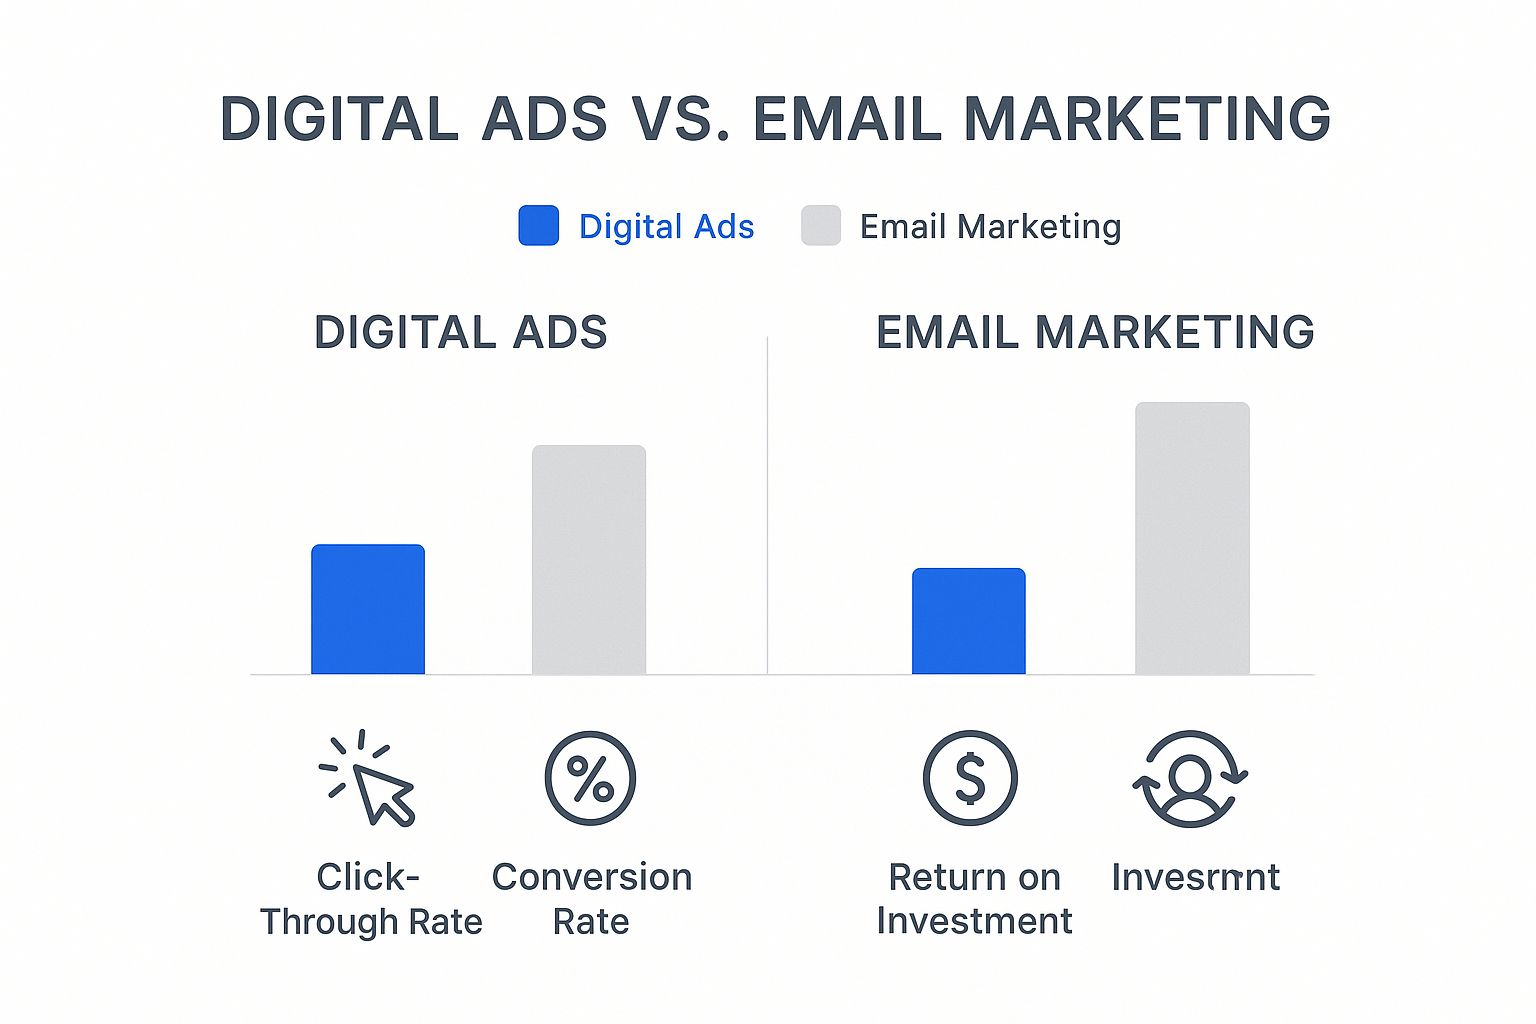
As you can see, email marketing can beat digital ads in conversion rate and ROI, even with a lower click-through rate. It’s a perfect example of why you must track performance at the channel level.
Building a Defensible Case for ROI
When you combine these advanced strategies, you create a powerful framework for proving your worth. You can use MMM to guide your budget decisions and then run A/B tests to fine-tune tactics within each channel.
This approach gives you a robust method for marketing performance tracking. It empowers you to confidently answer leadership's toughest questions with data-backed proof. Understanding the importance of sales tracking and how AI can improve accuracy also helps connect your marketing efforts directly to revenue, finally closing the loop on your ROI analysis.
Frequently Asked Questions
Here are answers to some of the most common questions about performance tracking. This section is a quick guide to help you clear up confusion and build a better measurement strategy.
How Often Should I Check My Marketing Metrics?
The simple answer is: it depends. For fast-moving metrics like ad clicks, impressions, and website traffic, you should check them daily or weekly. This helps you catch any sudden drops or make quick adjustments to a live campaign. For bigger-picture metrics like lead quality, conversion rates, and Return on Investment (ROI), a monthly or quarterly review is better. These numbers tell the real story of your strategy's health and should guide your long-term decisions.
What Is The Difference Between Marketing Analytics and Performance Tracking?
People often use these terms interchangeably, but they are different. Performance tracking is about collecting the raw data—like how many people clicked your ad. Marketing analytics is about interpreting that data to find patterns and understand why something happened. For example, analytics helps you understand why visitors from one channel converted at a higher rate than another. In short, tracking tells you what happened, while analytics tells you why it matters.
How Can I Track Marketing Performance Without A Big Budget For Tools?
You don't need expensive tools to start with solid marketing tracking. Many powerful tools are free. The key is to focus on what truly moves your business forward. You can start with free options like Google Analytics 4 for website data, the native analytics dashboards on social media platforms like Facebook, Instagram, and LinkedIn, and a simple spreadsheet to track your core KPIs. Master the basics with these free tools, show positive results, and then you'll have a strong case for investing in more advanced software later.
Which Attribution Model Is The Best One To Use?
There is no single "best" attribution model. The right one depends on your customer journey, sales cycle, and business goals. A last-touch model, which gives 100% of the credit to the final touchpoint, is simple but often misleading because it ignores all the previous interactions. For most businesses, a multi-touch model provides a more accurate picture. Models like linear (which splits credit evenly) or time-decay (which gives more weight to recent interactions) help you see the value in every step of the customer journey, from the first blog post they read to the final ad they clicked.
Ready to unify your customer data and get a crystal-clear view of your marketing performance? Markopolo provides AI-driven tools to automate your campaigns and gain real-time insights. Start optimizing your strategy today.

.jpg)
.png)
.jpg)


