
Before you can measure anything, you need to know what you're measuring against. We've all been guilty of setting fuzzy goals like "get more traffic" or "increase leads." But those aren't goals; they're wishes. A real goal is precise, like hitting a 15% increase in completed checkouts or bringing in 50 qualified demo requests this quarter. This is your yardstick. Everything else you do will be measured against it.
Defining What Success Looks Like for Your Campaign

Think of it this way: launching a campaign without clear objectives is like starting a road trip without a map. Sure, you're moving, but are you getting any closer to your destination? Or just burning gas? The foundation of a solid measurement plan is deciding what a "win" actually means for your business before you spend a single dollar.
Goals like "boost brand awareness" don't cut it. They're too vague to tell you if you're actually succeeding. Your objectives need to be tied directly to real business outcomes.
Moving Beyond Vague Goals with the SMART Framework
The SMART framework isn't just business jargon; it's a simple tool for turning foggy wishes into a concrete plan. It forces you to be clear about what you want to achieve.
Here’s a quick breakdown of how it works:
- Specific: Don't just "improve social media." A better goal is: "Increase our Instagram follower count by 500 new people from our target audience." Now you know exactly what to do.
- Measurable: You need a number you can track. "Increase engagement" is useless. "Achieve an average engagement rate of 3% on LinkedIn posts" is a number you can actually measure.
- Achievable: Be ambitious, but realistic. Trying to double your website traffic in a week is probably a fantasy. But a 20% increase over a full quarter? That’s a solid, challenging target.
- Relevant: Your goal has to matter to the bigger picture. If the company needs more sales, a campaign that just drives traffic that leaves immediately isn't helping.
- Time-bound: Every goal needs a deadline. It creates urgency and gives you a clear finish line. "Generate 50 qualified demo requests" becomes "Generate 50 qualified demo requests by the end of Q3."
By using this framework, you shift from hoping for results to planning for them. It gives everyone a clear understanding of what the campaign needs to do.
Tying Campaign Goals to Your Business Funnel
Your goals will also change based on where your campaign fits in the marketing funnel. You wouldn't use the same yardstick for a campaign introducing your brand as you would for one trying to close sales with people who already know you.
This simple table can help you pick the right metric for your goal.
As you can see, the right metric depends entirely on the job you're trying to get done.
For instance, a campaign for a new e-commerce store just trying to get its name out there would focus on:
- Reach: How many unique people saw your ads?
- Impressions: How many total times was your ad shown?
- Website Traffic: Getting those first clicks from social media or search ads to your site.
On the other hand, a campaign for a B2B software company trying to get sales would prioritize totally different things:
- Lead-to-Customer Rate: What percentage of leads actually become paying customers?
- Cost Per Acquisition (CPA): What's the final cost to get one new customer?
- Completed Demo Requests: A direct signal of interest from qualified people.
Setting these precise goals upfront is the most important step. It ensures you’re not just collecting data, but gathering the right data to prove your impact.
Choosing the Right Metrics That Actually Matter
Once you know your goals, you need a compass to get there. In marketing, that compass is your set of Key Performance Indicators (KPIs).
It’s easy to get lost in a sea of data. Clicks, impressions, bounce rates—most of it is just noise. The trick to measuring marketing campaign success is to ignore the vanity metrics and focus on the few numbers that truly show if your campaign is working and helping the business.
Think of it like a doctor checking your vital signs. They don’t measure every cell in your body. They focus on heart rate and blood pressure to get a clear picture of your health. Your marketing metrics should work the same way.
The Heavy Hitters: Revenue and Profitability Metrics
When you need to prove your worth, nothing speaks louder than money. That’s why revenue metrics are the champions of campaign measurement. They draw a straight line from your marketing efforts to business growth.
One of the most reliable metrics is Return on Investment (ROI). The formula is simple: divide the net profit from a campaign by its total cost.
For instance, if a campaign brings in $200,000 in revenue from a $50,000 spend, that's a 300% ROI. While anything over 100% means you’re profitable, most businesses aim for at least 200% to truly justify the spend. If you want to dive deeper, you can explore more about the essential marketing KPIs you should be tracking.
Another important one is Customer Lifetime Value (CLV). This metric predicts the total profit your business will make from a single customer over time. It helps you see if you're attracting customers who will stick around, not just make a one-off purchase.
Efficiency Metrics: How Well Are You Spending?
Making money is great, but are you spending it wisely? Efficiency metrics tell you how effective your campaign is at turning your budget into customers. They’re a pulse check for your budget’s health.
Here are two efficiency metrics you should always watch:
- Cost Per Acquisition (CPA): This is the total cost you pay to get one new paying customer. If you spend $1,000 on ads and get 10 new customers, your CPA is $100. The goal is to keep this number as low as possible without sacrificing the quality of customers.
- Conversion Rate: This shows the percentage of people who take the action you want them to—like making a purchase or filling out a form. A high conversion rate means your message is working. A low one tells you something is broken.
By balancing profitability metrics like ROI with efficiency metrics like CPA, you get a much fuller picture. It’s not just about how much money you made, but also how cost-effectively you made it. This balanced approach stops you from chasing high-revenue campaigns that are secretly losing money because the costs are too high.
Setting Up Your Tracking and Analytics Foundation
Alright, you've defined your goals and picked your KPIs. Now for the practical part—building the system that actually collects all that data.
Without solid tracking, your entire measurement plan fails. It’s like trying to build a house on sand. No matter how brilliant your campaign ideas are, you won't know if they worked if you can't measure them properly.
To get a real sense of your marketing success, you need clean, reliable data from the very beginning. This means getting the right tools in place.
The Non-Negotiables of Data Collection
Think of this as your essential starter kit. To get a clear picture of what's working, you have to know where your traffic is coming from and what people do when they get to your site.
- Google Analytics 4 (GA4): This is your command center for website data. Your first job is to set up conversion tracking in GA4. This is how you tell Google what actions matter to your business, whether it's someone buying a product or filling out a form.
- UTM Parameters: These are small bits of code you add to the end of your URLs. They act like name tags, telling you exactly which campaign or ad sent a visitor your way. Without them, your traffic gets lumped into vague buckets like "social," making it impossible to know which specific efforts are driving results.
- Tracking Pixels: If you're running ads on platforms like Meta or LinkedIn, you have to install their tracking pixels on your website. This tiny piece of code is a game-changer; it sends conversion data back to the ad platform, which then uses that info to automatically optimize your campaigns for you.
This is a great start, but to get a complete view, you'll need a mix of tools. For a deeper look, check out our guide on the 5 must-have analytics tools for every marketer.
Unifying Your Data in One Place
Let's be real: jumping between a dozen different tabs—Google Analytics, Meta Ads, LinkedIn—is exhausting and makes it hard to spot trends. You can't see the big picture when your data is in different places.
This is where a centralized marketing dashboard changes everything. When you pull all your data into a single view, you get an immediate, at-a-glance understanding of what’s happening across all your marketing efforts.
This infographic shows what a typical tracking setup looks like, showing how different data points flow into one central place for analysis.
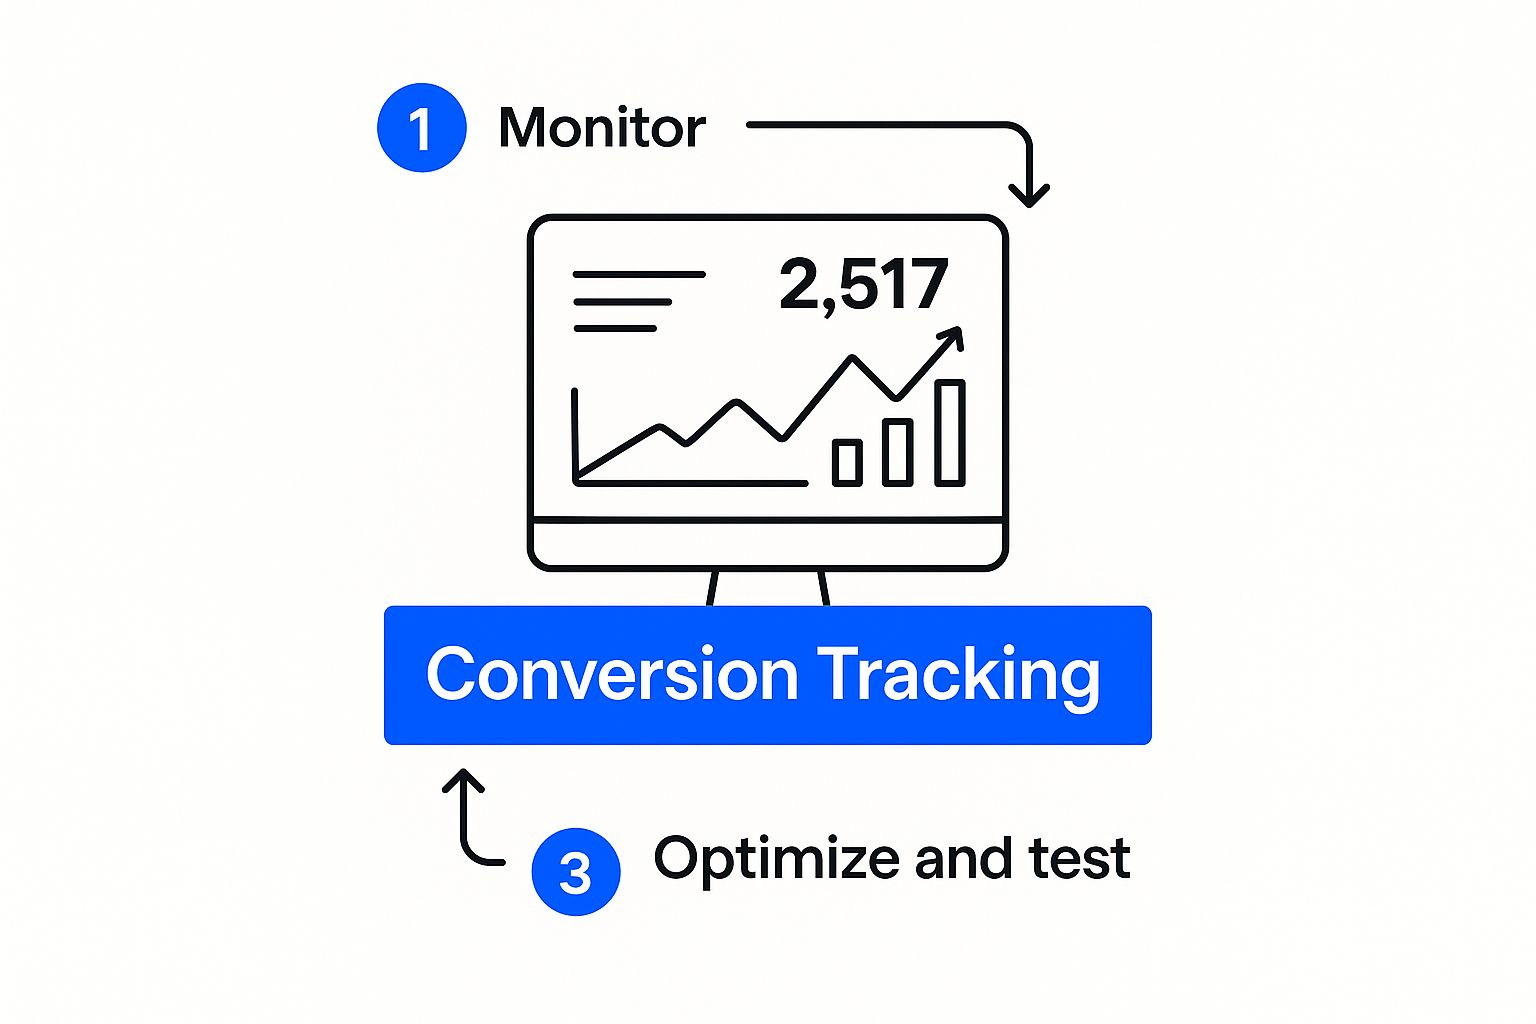
Being able to see key metrics like total conversions and conversion rates side-by-side is what allows you to make fast, smart decisions about where to put your budget and which strategies are working best.
Key Takeaway: Solid tracking isn't optional—it's the foundation of any successful campaign. Taking the time to set up GA4, use UTMs, and install your pixels will pay you back tenfold with clean, reliable data you can actually trust.
Analyzing Your Data to Find Actionable Insights
So, your tracking is set up and data is finally rolling in. This is where the real work begins. Anyone can collect numbers, but the true skill is turning that raw data into smart decisions for your business.
This part of the process is all about looking past the surface-level numbers and constantly asking, "Why?" Why did one ad perform so much better than the others? Why are people leaving our site right before checkout? Answering these questions is how you stop just reporting on results and start actively improving them.
Diagnosing Your Campaign's Health
Think of your core metrics as your campaign's vital signs. A low conversion rate, for instance, is like a fever—it tells you something is wrong, but you still need to figure out the cause. Is the landing page unclear? Is the ad targeting the wrong people? Or is the offer itself just not appealing enough?
Similarly, a high Cost Per Acquisition (CPA) might be a red flag. You have to ask if that cost is sustainable. If it costs you $100 to get a customer who only spends $75, you're losing money on every sale, no matter how many you make.
The goal is to make data-backed moves instead of guessing. Every metric tells a story, and your job is to figure out what’s working, what's failing, and how to fix it.
Finding Your Star Performers
One of the most valuable things you can do is compare performance across different channels. Is your Meta audience more engaged than your LinkedIn audience? Does Google Ads bring in better leads than your organic social media?
By looking at your data side-by-side, you can quickly spot your star players.
- Channel Performance: See which platforms are delivering the best Return on Ad Spend (ROAS). This tells you exactly where to put more of your budget.
- Ad Creative Analysis: Pinpoint which ad copy, images, or videos get the most clicks and conversions. This is gold for creating your next ad.
- Audience Segmentation: Dig into which demographic or interest group is responding best to your campaign. This lets you sharpen your targeting for better results.
Understanding the Conversion Funnel
Spotting the weak links in your process is a critical part of the analysis. For example, if you see a lot of people adding products to their cart but never checking out, you've found a clear problem. The cause could be anything from unexpected shipping costs to a confusing checkout process.
This analysis is directly tied to your conversion rate. This has been a key metric in digital marketing for years, showing the percentage of users who take a desired action. While average conversion rates for e-commerce and lead generation are often between 2% and 5% globally, a well-tuned campaign can easily hit 10% or more. By keeping a close eye on this number and using A/B testing to fix drop-off points, you can often see a big boost in results. For more on this, check out these insights on measuring campaign success on invoca.com.
Optimizing Your Campaigns for Better Results
Think of your marketing measurements not as a final report card, but as a live feedback loop. The insights you gather are just numbers until you use them to make your next move smarter. This cycle of analyzing and tweaking is what separates the campaigns that fizzle out from the ones that consistently deliver results.
Every dollar you spend should be a learning opportunity. Once you see what’s resonating with your audience, you can sharpen your message and double down on what works. This is how your marketing gets more powerful over time.
Turning Insights into Action
With good data, you can stop guessing and start making targeted improvements that have a real impact. Optimization isn’t about huge, sweeping changes; it’s about making small, smart adjustments based on what the numbers are telling you.
Here’s what that looks like in the real world:
- A/B Testing Key Elements: If your landing page conversion rate is low, run a controlled test comparing your current headline against a new one. We have a complete guide on how to do this in our article on A/B testing.
- Budget Reallocation: If your data shows that ads on one social media platform have a Cost Per Acquisition (CPA) of $20, while another is $60, the smart move is obvious: shift more of your budget to the channel that's performing better.
- Refining Audience Targeting: Dig into the demographics of the people who are actually buying from you. You might find your best customers are in a different age group than you thought. Use that info to tighten your targeting and stop wasting money on the wrong audience.
The Power of Financial Efficiency Metrics
Understanding your financial efficiency is what separates the pros from the amateurs. One of the most critical metrics here is the Cost per Acquisition (CPA), which tells you exactly what you're paying, on average, for each new customer. CPA became a cornerstone of digital advertising around 2010 when data tracking got much more precise.
For context, the average CPA for e-commerce companies was around $45 in 2023. Smart marketers often compare this against the Customer Lifetime Value (CLTV). A good rule of thumb is to maintain a CLTV-to-CPA ratio of at least 3:1 to ensure you’re building a profitable business.
By documenting every test, win, and loss, you build a library of knowledge. This record prevents you from repeating mistakes and helps your team make better decisions in the future.
Ultimately, reaching peak performance comes from applying strategies like revenue management principles to your marketing. This constant cycle of learning and improving is the true engine of long-term growth.
Frequently Asked Questions (FAQs)
How often should I check my campaign metrics?
This depends on the type of campaign. For fast-moving digital campaigns like Google Ads or Meta advertising, a quick daily check-in on key metrics like CPA and conversions is a good idea. This helps you catch big problems early. Then, a more in-depth weekly review is great for spotting trends and making strategic changes. For slower strategies like SEO or content marketing, a monthly analysis usually makes more sense.
What is a good marketing ROI?
The honest answer is: it depends. A "good" Return on Investment (ROI) varies based on your industry and profit margins. However, a common benchmark for a strong marketing ROI is a 5:1 ratio. This means you're generating $5 in revenue for every $1 you spend. A 2:1 ratio might just be breaking even after you factor in other business costs. The most important thing is to calculate what's profitable for your business and aim to beat that.
What's the difference between metrics and KPIs?
People often use these terms interchangeably, but they have different meanings. Knowing the difference helps you focus on what really matters.
- A metric is any data point you can measure (e.g., website clicks, video views).
- A Key Performance Indicator (KPI) is a specific metric you've chosen because it directly tracks your progress toward an important business goal.
For example, total website clicks is a metric. But Cost Per Qualified Lead is a KPI because it ties directly to the business goal of generating profitable leads. In short, all KPIs are metrics, but only the most important metrics are KPIs.
How can I measure an offline marketing campaign?
Tracking offline efforts like print ads or podcast sponsorships requires a little creativity. The trick is to create a trackable link between the offline ad and your digital results. You can do this by using:
- A unique phone number used only for that ad.
- A special discount code, like "PODCAST20."
- A unique, easy-to-remember landing page URL (e.g.,
yourwebsite.com/offer).
Using one of these methods allows you to connect any calls, sales, or website traffic directly back to that specific offline campaign, so you know exactly what's working.

.png)
.png)


